Saturday, May 2, 2015

April 2015 + 3.10%

Someone of a pedestrian month.  But I end my losing streak. Given the choppy conditions


I got hit pretty hard on a April 17, when the markets sold off but my positions snapped back pretty quickly.


on a YTD, I am still down -10.25 so I have work to do 


Wednesday, April 15, 2015

March 2015 -10.17

I had a very bad month closing down 10.17%.  


There was no rapid drop was a slow and painful bleed this month. 


The big problem this month was the absence of any big winner.  My biggest was less than a 1% portfolio gain.  By comparison my biggest loser was nearly a 2% portfolio loss. Most months I'll have a big gain that will be a 3-4% portfolio gain, which takes care of a lot of small losses.   

I also had a few trades that were bigger losses than I should have had.  I should not have been taken 1% losses without the winners.  I need to concentrate on keeping the losses small and letting some winners grow.  

Tuesday, March 3, 2015

February -1.56

Febuary ended in the red, despite a fantastic 2 week run.  It ended harsh when I took a binary risk on RESN earnings as neglected to check  the date when I took the position.   That was worth -3.8% on that trade alone. 


Saturday, January 31, 2015

January 2015 -1.56%

The first month in the year is now in the books. I lost -1.56% on the month.  Not the start to the year I  hoped for but it is a reflection of market conditions.


My performance was about par for the course as the major indices like wise were relatively flat.


How Did I Get There?
The first day of the year bounced hard in my favor. After that my positions faded. I had made steady progress until the last day of the month, when it seemed that everything went against me causing me to close in the red on the month. This shows that I am able to dig myself out of these small dips in my equity and climb higher. 


Closed Trades

# Winning Trades# Losing Trades# Wash Trades# Closed Trades% Win/LossAvg Winner  / Avg Loser


191533755.9%1.29/1


What went right?

On an individual trade level there some positive developments.  I had taken the approach of looking to weekly setups and breakouts in hopes for bigger gains.

Using this approach I bought RESN from the breakout at 9. I added on the pull back to 10 mid January  It was this pull back that caused the dip in my equity curve during the middle of January, but this dip was short lived.  I had a big position which I exited at 15.90 and 14.60.


My take away from this trade is that this approach does work, but that I need to prepare myself for bigger drawdowns--even on successful trades.   I should look to sell the thrust and buy the dips when
the larger trend is intact.

What went wrong?

January 2015 was a choppy market that failed to trend.  Many of my trades worked the first day and then went against me the next.  Had I closed the position for 1%-1.5% portfolio gains instead of .5% losses I could have closed up a couple % on the month.  But I also would have missed the bulk of a move in RESN so it cuts both ways.


Open Positions:
Its my open position's fade on Friday that swung me into the red.  As my stats show, I was up on the month from the trades I closed.  So, things will either get uglier if stops are hit, or I could sit pretty if my positions rebound.


Perspective

My equity curve  since opening this account is below. Initially, I did not do much with this account.  I took some positions without knowing how to trade and gradually worked down to a 20% drawdown.  I then put a lot of work into learning how to trade and my efforts thus far have been rewarded. As frustrating as trading can be on a day-to-day, trade-to-trade basis, I recognize that my efforts and hard work are being rewarded. 


Wednesday, December 31, 2014

2014 +47.42% / December +1.86

After a volatile December that I managed to eke out a 1.86% gain.

My year is complete and I end the year up 47%. 


Still, this is somewhat unsatisfactory as I end the year still not recovered from my drawdown from November. It also did not help that I got caught on the wrong side of early December's pull back. This prevented me from catching my highs despite a strong last two weeks. 


So how did I do it?

A lot of hard work and grinding out small trades--Over 250 and keeping losses low. I had a 56% win rate and an average win/loss ratio of 1.03/1.  Still that is somewhat skewed by outliers on both sides.

Where do I go from here?

I'm reevaluating a few set ups.  I'm looking at reducing the number of trades I take by looking to capture bigger moves.  This will require stronger stocks, avoiding noise, looser stops and smaller positions.  

My most profitable trade was the 20 point 50% move I caught in HCLP at the beginning of this year.   A few trades like contribute more to my bottom line than the 200+ momo burst setups.


Sunday, December 14, 2014

November: - 10.55% + YTD 44.73%

The Disaster that was my FUEL trade obviously affects my bottom line.  November by far is my worst month of the year:


The equity curve got hit pretty quickly in November as the FUEL trade lost quickly and lost big:


My YTD stats are still respectable:


Trades: 31
Winners: 13
Losers: 18
Avg:
Most profitable trade: VTAE, HCLP
Least Profitable: FUEL


Saturday, November 1, 2014

Wednesday, October 1, 2014

September -4.13 / Q3

September has historically been a negative period in the markets and this year was not an exception.  Like the major indexes I was also down.  -4.13%  so it was not an especially a fun month. 


Saturday, August 30, 2014

August 2014: +7.33 / 44.91% YTD

After a rough end of July and rough start to August, the market turned and I captured some nice gains the last two weeks.

 Monthly stats:

Friday, August 1, 2014

July 2014 .. Winning Streak ends. -3.34%


This month nothing was smooth.  My trade journals noted a lot of apprehension. Breakout trades were not working.  I fought back some sharp losses and nearly closed positive on the month but yesterday's 300 point sell off did me in stopping me out of some positions and ending the monthly win streak.


Thursday, July 3, 2014

Monday, June 2, 2014

YTD Progress Report Through May 2014.

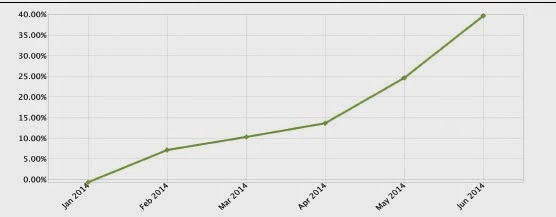
May is now in the books, and what a May it was.  Best month of the year bringing YTD return up to 24.64%

Sunday, April 13, 2014

QTR 1, 2014

I finished 2013 strong and continued that trend,.  It is earning season again so I thought I would focus on my own. +13.61 YTD % 


My quarter return rode a strong February and performed well during March.  April added 2.97 to start Q2.

2013

This year ended much better than 2012:

And yet, I still underperformed the market indices:

I got a slow start to the year,  but in August I was on a tear.  My NOK position got a big boost after MSFT bought out their handset division.

Tuesday, January 1, 2013

2012 Year Summary

Well it pretty much sucked... -12.56%

By comparison, it get's worse:


So what happened?   I did not have many big winners. There were relatively few big losers although, I got beat up by some legacy losses early in the year.

I got busy with other commitments and went largely to cash in June 2012, which is where the indices really started to pick up steam.  In other words, my underperformance owes much to nonperformance.


Thursday, June 7, 2012

May 2012: The Drawdown continues

May was a bad month.  I didn't make too many trades and the ones I did make got slammed.  Down Nearly 5% on the month.


Overall, it was a brutal period in the markets and I actually out performed the SPY over the same period.  Still, it's not much consolation when money comes out of the account

Monday, April 30, 2012

Thursday, March 29, 2012

March

Not quite the end of the month, but here is the 30 day performance.  4.18%

And I beat all of the indices:
With less risk: